
Every time you get behind the wheel, you’re making a calculation you probably don’t think about consciously, and that’s largely a good thing. Driving is so routine that the risks fade into the background. But those risks are real, and understanding them clearly isn’t morbid; it’s useful. It can change how you drive, what safety features you prioritize in your next car, and how seriously you take habits that feel harmless but aren’t.
So what are the actual odds of dying in a car crash? The answer depends on how you measure it—lifetime risk, per mile, or per trip—and on a set of personal factors that can push your individual number well above or below the average. Here’s what the data actually says.
What Are the Odds of Dying in a Car Crash?
The most commonly cited figure comes from the National Safety Council (NSC), which calculates lifetime odds of dying in a motor vehicle crash at approximately 1 in 93 for Americans. This means that over the course of your life, you have roughly a 1% chance of dying in a car accident. That makes it one of the leading causes of accidental death in the United States.
To put a finer point on it, NHTSA recorded 40,901 fatalities in 2023, with early 2024 estimates coming in slightly lower at 39,345. This is the first time the number has fallen below 40,000 since 2020. Progress, but not enough to feel comfortable about. It sounds abstract until you consider that 40,000 deaths a year is roughly the population of a small city, erased annually from U.S. roads.
On a per-trip basis, the picture looks more reassuring. Using NHTSA's fatality rate of 1.26 deaths per 100 million vehicle miles traveled and an average U.S. trip length of around 10 miles, the chance of dying on any individual trip works out to roughly 1 in 8 million. Vanishingly small for a single errand, but one that compounds relentlessly across a lifetime of driving.
Risk is also commonly expressed per mile driven. That same 1.26 deaths per 100 million VMT, down from 1.37 in recent prior years, reflects real progress but still marks U.S. roads as significantly more dangerous per mile than commercial aviation or intercity rail.

How Car Crash Fatality Risk Is Calculated
Fatality statistics come from several sources: the NSC, the National Highway Traffic Safety Administration (NHTSA), and the Insurance Institute for Highway Safety (IIHS). They slice the data in different ways depending on what question they’re trying to answer.
Lifetime risk aggregates annual crash deaths against the total population and the average lifespan. It’s the most useful number for a general sense of overall danger, but it’s an average that hides enormous individual variation.
Per-mile risk divides fatalities by total miles driven. Currently tracked at roughly 3 trillion miles annually in the U.S., this metric is most useful for comparing car travel to other forms of transportation or for understanding how exposure (how much you drive) affects your risk.
Per-trip risk is the lowest and most reassuring number, since most trips are short and uneventful. But it underweights the reality that longer trips and highway driving carry significantly different risk profiles than a two-mile errand.
The variation between these measurements is why headlines about car safety can seem contradictory. A number that sounds alarming in one framing looks trivial in another. The lifetime figure is generally the most honest representation of how car crashes stack up as a cause of death.
Key Factors That Affect Your Risk in a Car Crash
The 1-in-93 lifetime figure is a population average, and your personal odds can diverge significantly depending on a handful of factors that are largely within your control.
- Speed. Physics is unforgiving here. The energy released in a crash increases with the square of speed, which means a crash at 60 mph isn’t twice as bad as one at 30 mph; it’s four times as bad. Speeding is a factor in roughly 29% of all U.S. traffic fatalities.
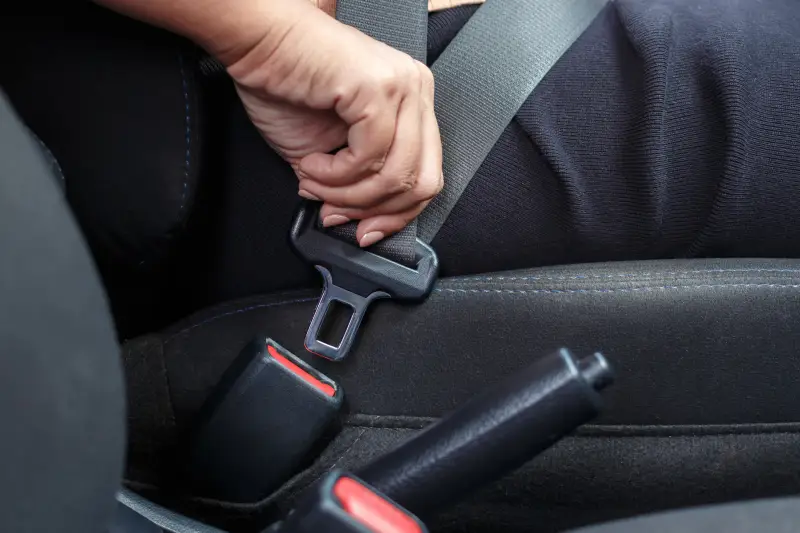
- Seatbelt use. Seatbelts reduce the risk of death in a crash by about 45% for front-seat passengers and 60% for light-truck occupants, according to NHTSA. Despite this, roughly 1 in 10 Americans still doesn’t buckle up consistently.
- Impaired driving. Alcohol-impaired driving accounts for about 32% of all U.S. traffic deaths, more than 12,000 deaths per year. Drug impairment, including prescription medications, adds to that number in ways that are harder to track but no less real.
- Distraction. Glancing at your phone for five seconds at 55 mph means traveling the length of a football field without looking at the road. Distracted driving kills more than 3,000 people annually in the U.S., a figure that researchers believe is significantly undercounted because distraction is difficult to prove after the fact.
- Time of day and road type. Fatal crash rates peak between 9 p.m. and midnight, and rural roads, despite carrying far less traffic than urban roads, account for about half of all traffic fatalities. The combination of higher speeds, less lighting, longer emergency response times, and fewer guardrails makes rural driving meaningfully more dangerous per mile.
- Driver age. Teen drivers (16–19) have crash rates nearly three times higher than drivers aged 20 and older. On the other end of the spectrum, drivers over 70 face increasing risk due to slower reaction times and greater physical fragility in crashes.
Are Car Crashes More Dangerous Than Other Risks?
Context matters when evaluating any risk, and car crashes are worth comparing to the other ways Americans die.
|
Cause of Death |
Lifetime Odds (U.S.) |
Annual Deaths (approx.) |
|
Heart disease |
1 in 6 |
~695,000 |
|
Cancer |
1 in 7 |
~608,000 |
|
Car crash |
1 in 101 |
~40,000 |
|
Fall |
1 in 106 |
~44,000 |
|
Drowning |
1 in 1,020 |
~4,000 |
|
Lightning strike |
1 in 138,849 |
~20 |
Source: National Safety Council, Injury Facts; CDC National Center for Health Statistics. Figures are approximate and based on recent multi-year averages.
Car crashes sit in an uncomfortable middle ground, not as common as heart disease or cancer, but far more likely than the dramatic causes of death (plane crashes, shark attacks, lightning strikes) that tend to dominate people’s fear responses. The psychologist Paul Slovic has written extensively about this gap. People systematically overestimate vivid, dramatic risks and underestimate familiar ones. Car crashes are so routine that they feel manageable even when the data suggests otherwise.
For context, you are roughly 95 times more likely to die in a car crash than in a plane crash over your lifetime. And yet most people report feeling far more anxious about boarding a flight than merging onto a freeway.
How to Reduce Your Risk of Dying in a Car Crash
The good news, and it is genuinely good news, is that most of the factors driving car crash fatalities are controllable. Here’s where the evidence points most clearly.
- Wear your seatbelt every time. It’s the single highest-impact thing you can do. A 45% reduction in fatality risk is not a marginal improvement. It’s the difference between surviving a serious crash and not.
- Put the phone down. Hands-free isn’t as safe as it sounds. Cognitive distraction lingers even after you end a call. But eyes-off-road phone use is in a different category of danger entirely. It’s not worth it.
- Don’t drive impaired. This applies to alcohol, recreational drugs, and, often overlooked, prescription medications that affect alertness or reaction time. If the label says “may cause drowsiness,” take that seriously behind the wheel.
- Slow down, particularly on unfamiliar roads. Speed limits on rural roads are often set for ideal daytime conditions. At night, in rain, or on roads you don’t know well, those limits deserve more caution, not less.
- Maintain your vehicle. Tire blowouts, brake failures, and worn wiper blades cause real crashes. Routine maintenance isn’t just about avoiding repair bills; it’s a safety practice.
- Let the car help you. Modern safety systems, including automatic emergency braking, lane departure warning, and blind-spot monitoring, have measurable effects on crash rates. Using them, and not disabling them out of habit, matters.
Trends in Car Crash Fatalities Over Time
The long-term trajectory here is genuinely encouraging, even if recent years have complicated the story.
U.S. traffic fatalities peaked at 54,589 in 1972 and fell steadily for decades, reaching a modern low of around 32,479 in 2011. That decline was driven by a combination of forces, including mandatory seatbelt laws, stricter drunk driving enforcement, improved vehicle safety engineering, better road design, and advances in trauma medicine. By almost any measure, driving in the U.S. became dramatically safer over those four decades.
Then the trend reversed. Fatalities climbed back above 40,000 in 2016 and have remained elevated. The primary culprits, according to NHTSA and safety researchers, are smartphone distraction, the increasing size and weight of the SUV and pickup truck fleet, and rising speeds on roads that emptied out during the pandemic and never fully returned to pre-pandemic behavior patterns.
Advanced driver assistance systems (ADAS), including automatic emergency braking, adaptive cruise control, and lane-keeping assist, are increasingly standard equipment and have demonstrated real-world effectiveness in reducing crashes. Fully autonomous vehicles remain a more distant and contested prospect.
The near-term trajectory of fatality rates will likely depend less on autonomous technology than on whether distracted driving trends improve and whether the shift toward heavier vehicles continues.
The per-mile fatality rate is still far lower than it was in 1972, roughly one-fifth as deadly on a per-mile basis. But with Americans driving more total miles than ever, the raw death count has proven stubbornly difficult to push below 35,000.
FAQs
What are the chances of dying in a car crash?
The lifetime odds for an American are approximately 1 in 93, according to the National Safety Council, making it one of the more significant accidental causes of death. That figure averages across all drivers and passengers, all road types, and all behaviors. Your individual odds are meaningfully lower if you consistently wear a seatbelt, avoid impaired and distracted driving, and drive at appropriate speeds.
How likely is it to die in a car accident per trip?
On a per-trip basis, the odds are extremely low, roughly 1 in 100 million for any individual trip. But Americans collectively take hundreds of billions of trips per year, which is how those microscopic per-trip odds translate into 40,000 deaths annually. The per-trip framing is statistically accurate but can create a false sense of security about cumulative lifetime exposure.
Are highways more dangerous than city roads?
It depends on how you measure it. Urban roads have higher crash frequency because of more vehicles, more intersections, and more pedestrians. But rural and highway driving accounts for a disproportionate share of fatalities, primarily because higher speeds mean crashes are more likely to be fatal when they do occur. Rural roads account for roughly half of all U.S. traffic deaths despite carrying a minority of total traffic volume.
Does wearing a seatbelt reduce the risk of death?
Substantially, yes. NHTSA data consistently shows that seatbelts reduce fatality risk by approximately 45% for front-seat car occupants and up to 60% for light truck occupants. In practical terms, seatbelts save roughly 15,000 lives per year in the U.S., and an estimated 2,500 additional lives could be saved annually if seatbelt use were universal.
Who is most at risk in car crashes?
Teen drivers carry the highest crash risk by age group. Inexperience, overconfidence, and peer distraction are a dangerous combination. Male drivers of all ages have significantly higher fatality rates than female drivers, largely due to higher rates of speeding and impaired driving.
Motorcyclists face a fatality rate roughly 24 times higher per mile traveled than passenger car occupants. And passengers in larger, heavier vehicles, for example full-size SUVs and pickup trucks, fare considerably better in multi-vehicle crashes than occupants of smaller cars, though that safety advantage comes at a cost to the other vehicle